📋 What are Connection Logs?
Connection logs are detailed records of your VPN connection attempts, including server responses, authentication steps, and any errors encountered. These logs are essential for our support team to diagnose and resolve connection issues.
Why Enable Debug Logs?
🔍 Troubleshooting
Identify connection failures, authentication issues, or protocol problems
⚡ Performance Issues
Diagnose slow speeds, frequent disconnections, or timeout errors
🛠️ Configuration Errors
Find incorrect settings, firewall blocks, or DNS resolution problems
📊 Network Analysis
Understand routing issues, MTU problems, or ISP interference
What Information is Logged?
🔒 Privacy Notice
Connection logs contain technical information only:
- ✓ Connection timestamps and server IPs
- ✓ Protocol negotiations and handshake data
- ✓ Error messages and status codes
- ✓ Network adapter information
- ✗ NO browsing history or traffic content
- ✗ NO personal data beyond username
Step-by-Step Guide
1Open TorGuard Settings
Launch the TorGuard Desktop Client and click the settings cog icon in the top-right corner:
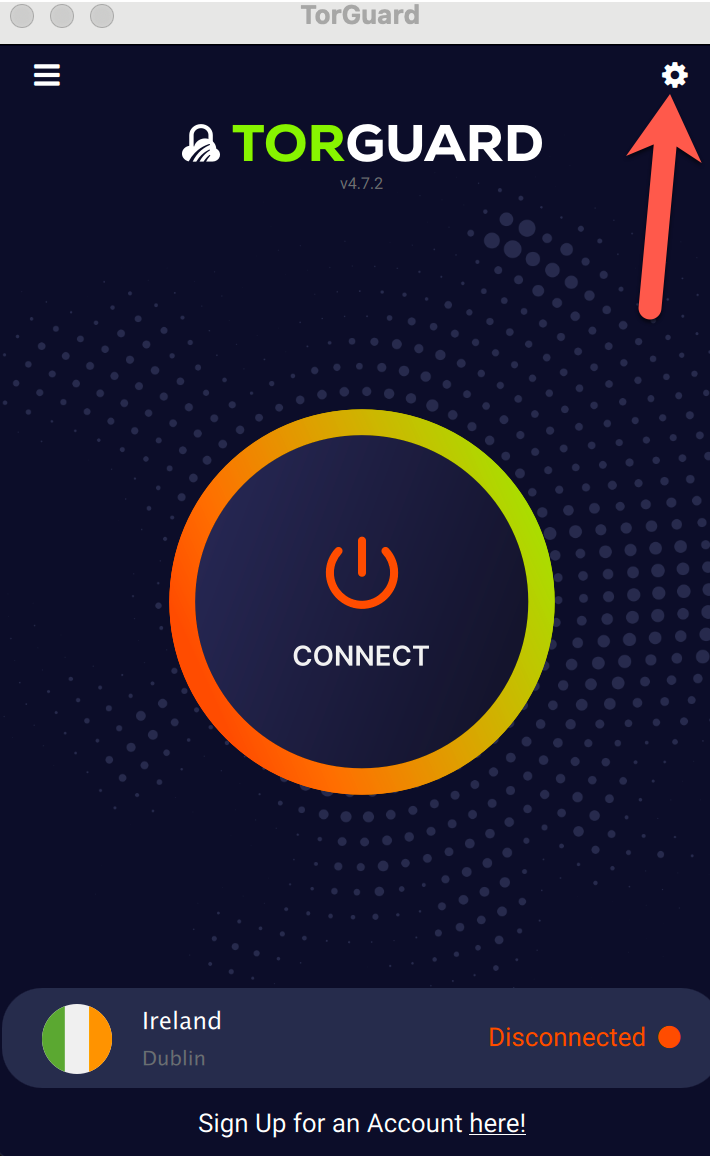
Click the settings gear icon
2Navigate to Debug Tab
In the settings window, click on the "Debug" tab:
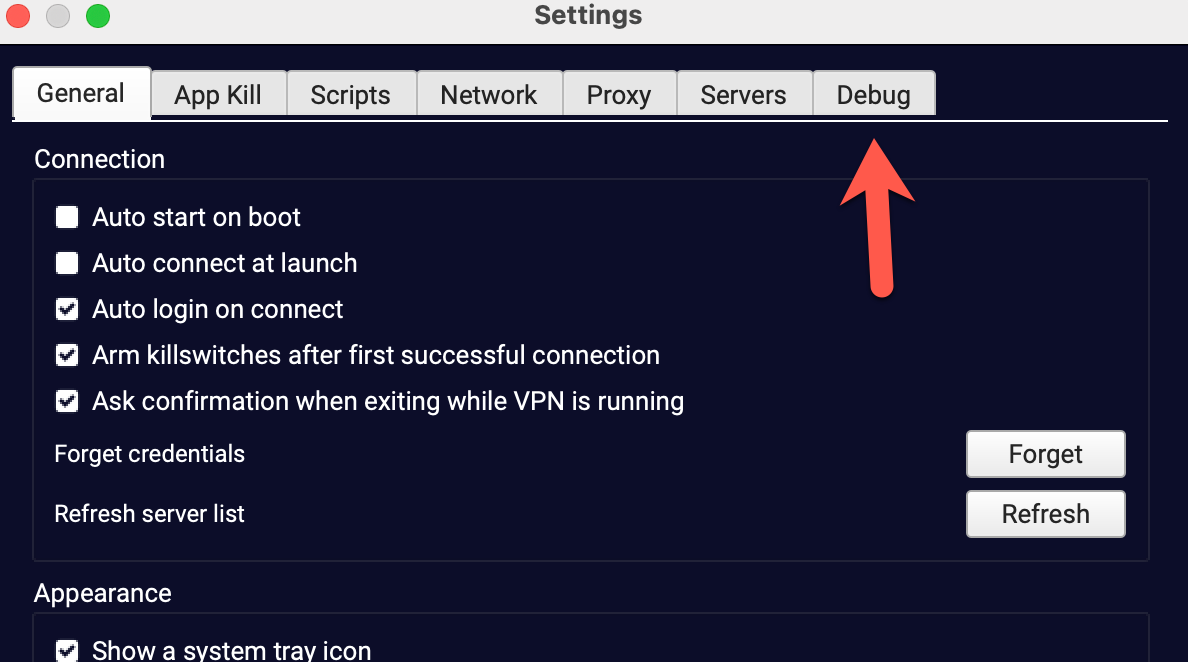
Select the Debug tab from settings
3Enable File Logging
Change the Debug dropdown from "Disabled" to "File" and click Save:
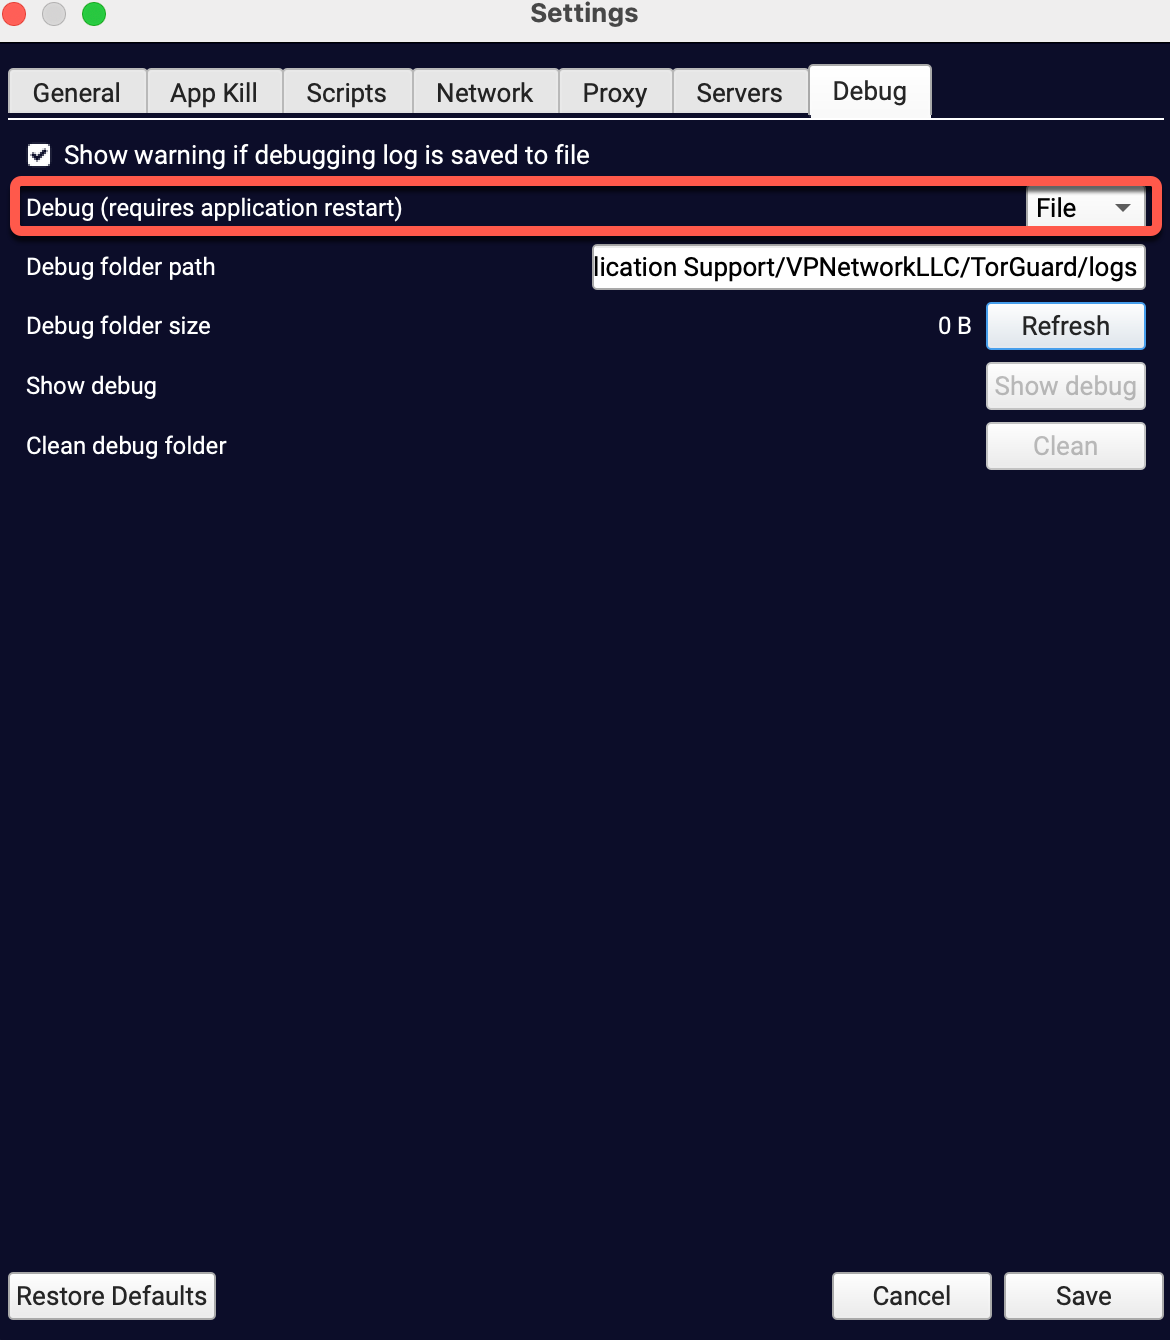
Select "File" from the dropdown menu
⚠️ Restart Required
You must restart the TorGuard client for debug logging to take effect. Click "Yes" when prompted:
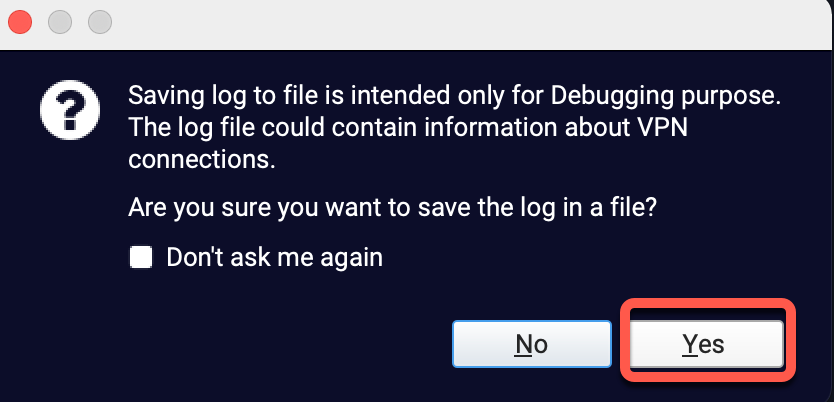
Confirm the restart to enable logging
4Reproduce the Issue
After restarting:
- Attempt to connect to VPN
- Try to reproduce the issue you're experiencing
- Let it run for at least 30 seconds
- If connection fails, wait for the full timeout
5Access Debug Logs
Return to Settings → Debug tab and click "Show debug":
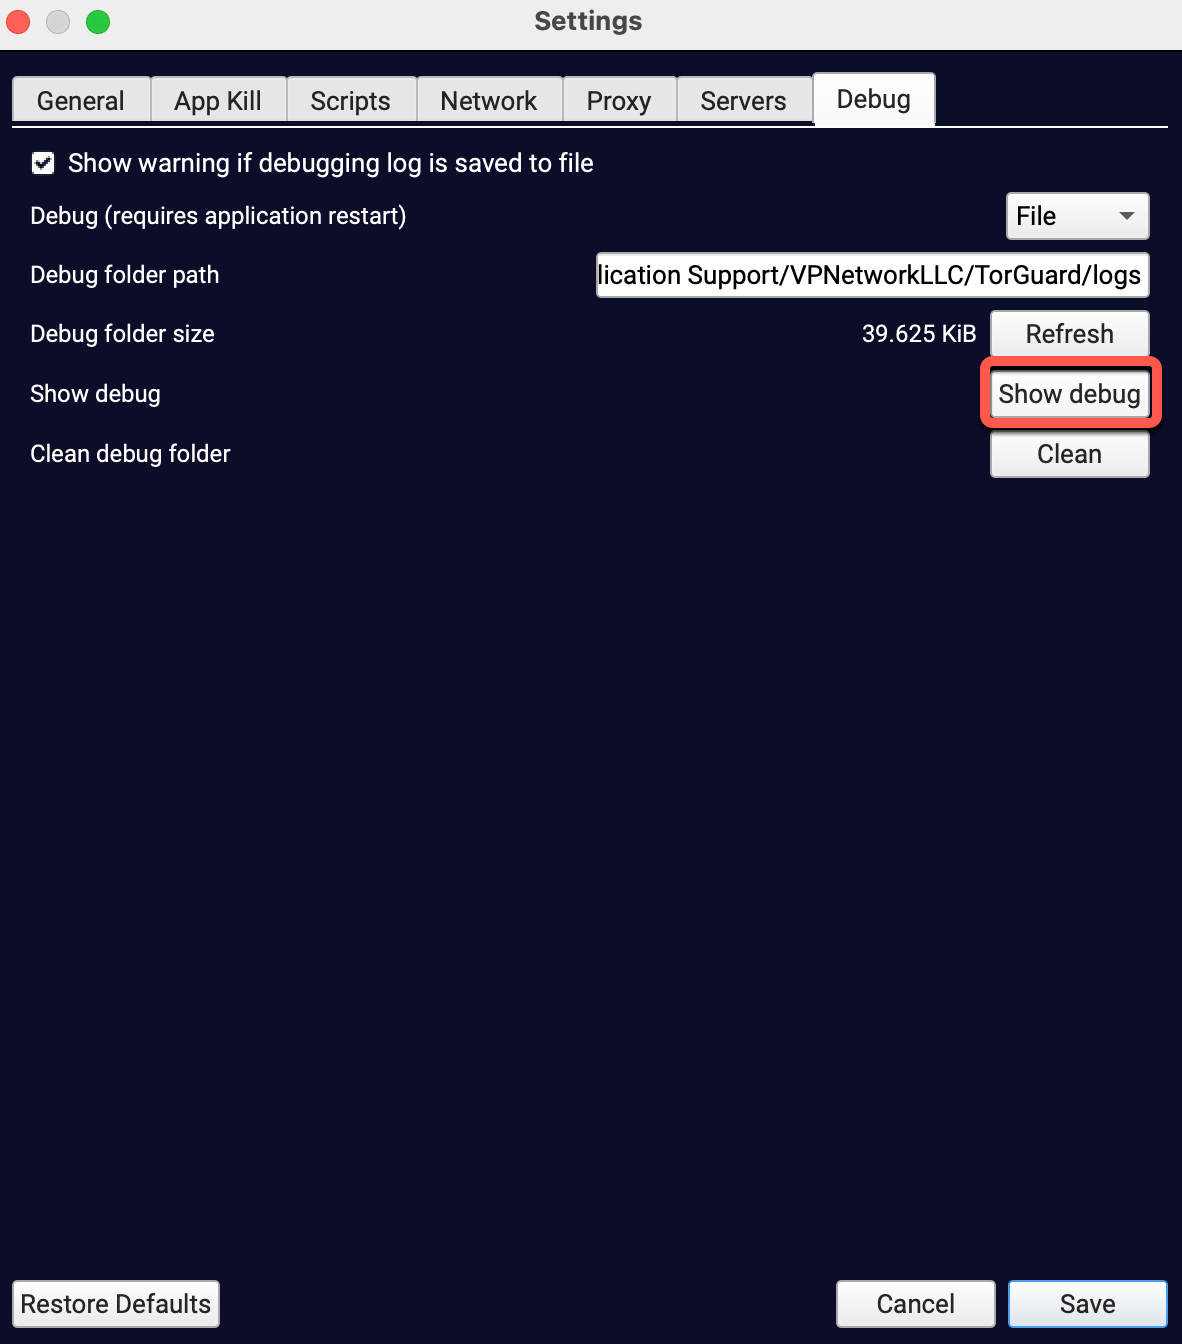
Click "Show debug" to view logs
6Copy Logs to Clipboard
In the debug window, click "Copy to Clipboard" to copy all log data:
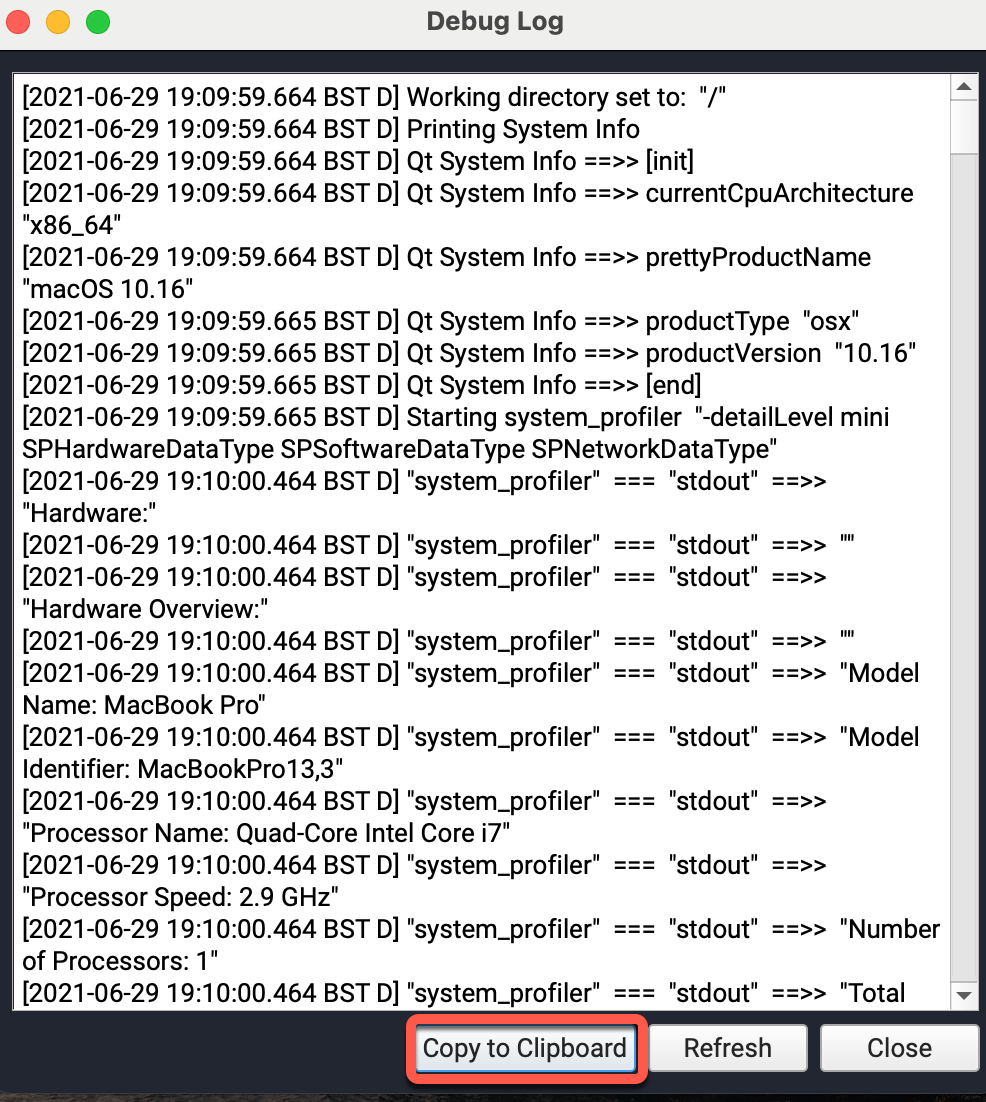
Use "Copy to Clipboard" to capture all logs
Log File Locations
Windows Log Locations
Debug logs are stored at:
C:\Users\[Username]\AppData\Roaming\TorGuard\debug.log
OpenVPN logs:
C:\Users\[Username]\AppData\Roaming\TorGuard\logs\
To quickly access:
- Press Win + R
- Type
%APPDATA%\TorGuard - Press Enter
macOS Log Locations
Debug logs are stored at:
~/Library/Application Support/TorGuard/debug.log
OpenVPN logs:
~/Library/Application Support/TorGuard/logs/
To quickly access:
- Open Finder
- Press Cmd + Shift + G
- Type
~/Library/Application Support/TorGuard - Press Enter
Linux Log Locations
Debug logs are stored at:
~/.config/TorGuard/debug.log
OpenVPN logs:
~/.config/TorGuard/logs/
To quickly access:
cd ~/.config/TorGuard
cat debug.log
Understanding Log Contents
Example log output:
2024-01-15 10:23:45 - Starting TorGuard v4.8.5
2024-01-15 10:23:45 - OS: Windows 10 (10.0.19045)
2024-01-15 10:23:46 - TAP adapter found: {GUID}
2024-01-15 10:23:47 - Connecting to USA-NEW-YORK
2024-01-15 10:23:47 - Protocol: OpenVPN UDP
2024-01-15 10:23:48 - AUTH: Username/password authentication
2024-01-15 10:23:49 - TLS handshake completed
2024-01-15 10:23:50 - Connected successfully
2024-01-15 10:23:50 - Local IP: 10.9.0.123
2024-01-15 10:23:50 - Public IP: 23.xxx.xxx.xxx
Common Log Entries Explained
🔴 "AUTH_FAILED"
Invalid username/password or expired account
🟡 "TLS handshake failed"
Certificate issues or protocol mismatch
🔵 "Connection timeout"
Server unreachable, firewall blocking, or ISP interference
🟢 "Initialization Sequence Completed"
Successful connection established
⚪ "RESOLVE: Cannot resolve host"
DNS issues or incorrect server address
Sharing Logs with Support
✅ Best Practices
- Include Full Logs: Don't trim or edit the logs
- Describe the Issue: Explain what you were trying to do
- Mention Error Messages: Include any popup errors
- Provide Context: OS version, network type, ISP
- Use Secure Methods: Only share via official support channels
How to Submit Logs
- Copy logs to clipboard (Step 6 above)
- Visit TorGuard Support
- Create a new ticket
- Paste logs in the message or attach as .txt file
- Submit ticket and await response
Privacy & Security
Disabling Debug Logs
After troubleshooting is complete:
- Go to Settings → Debug tab
- Change dropdown back to "Disabled"
- Click Save and restart client
- Delete old log files if desired
Advanced Troubleshooting
Verbose Logging
For deeper issues, support may request verbose logs:
- Add
verb 4to custom OpenVPN config - Increases log detail level
- May significantly increase log file size
Real-time Log Viewing
To watch logs in real-time on Windows:
Get-Content "$env:APPDATA\TorGuard\debug.log" -Wait -Tail 50On macOS/Linux:
tail -f ~/.config/TorGuard/debug.logCommon Issues Requiring Logs
- Connection timeouts or failures
- Authentication errors
- Slow connection speeds
- Frequent disconnections
- Protocol-specific issues
- DNS resolution problems
- Firewall or antivirus conflicts
Need Help?
If you're having trouble generating or understanding logs:
Our team will guide you through the logging process